TLDR: The GameStop collectibles sales 2026 figures show a striking change in the retailer’s sales mix. Collectibles generated $356.3 million, or 45.1% of quarterly net sales, and became GameStop’s largest disclosed product category. However, that figure includes trading cards alongside figures, apparel, plush, board games, building sets, home goods and card-grading submission fees. The results establish that collector-oriented retail is increasingly important to GameStop, not that trading cards alone produced the shift.
GameStop’s fiscal second-quarter results put the company in an unusual position: Its collectibles category now generates substantially more sales than its broadly defined Video Games category. That is meaningful for a retailer historically identified with new releases, consoles and used games. It also requires careful interpretation because GameStop changed its category presentation this quarter and does not disclose sales or profit for individual collectibles subcategories.
What the GameStop collectibles sales 2026 results show
For the 13 weeks ended August 1, 2026, GameStop reported total net sales of $790.2 million. That was down from $972.2 million in the recast prior-year quarter. Collectibles moved in the opposite direction, climbing from $227.6 million to $356.3 million, a reported increase of 57%. Its share of net sales consequently rose from 23.4% to 45.1%.
| Category | Q2 2026 net sales | Recast Q2 2025 net sales | Year-over-year movement |
|---|---|---|---|
| Collectibles | $356.3 million | $227.6 million | Up $128.7 million; 57% growth |
| Video Games | $263.2 million | $494.6 million | Down $231.4 million |
| Pre-Owned & Refurbished | $170.7 million | $250.0 million | Down $79.3 million |
| Total | $790.2 million | $972.2 million | Down $182.0 million |
Those comparisons use the prior-year figures GameStop recast to conform to its new product-category presentation. The company began reporting under the new categories in Q2 2026, so the year-over-year comparison is usable, but attempting to extend the same framework across older results would require additional care.
The clearest conclusion is about mix rather than scale. GameStop’s total quarterly sales contracted, yet collectibles added $128.7 million and became the largest of its three disclosed categories. At 45.1% of net sales, the category was almost twice as important to the quarterly mix as it had been one year earlier. That makes collector-oriented merchandise difficult to treat as a sideline.
Collectibles does not mean trading cards alone
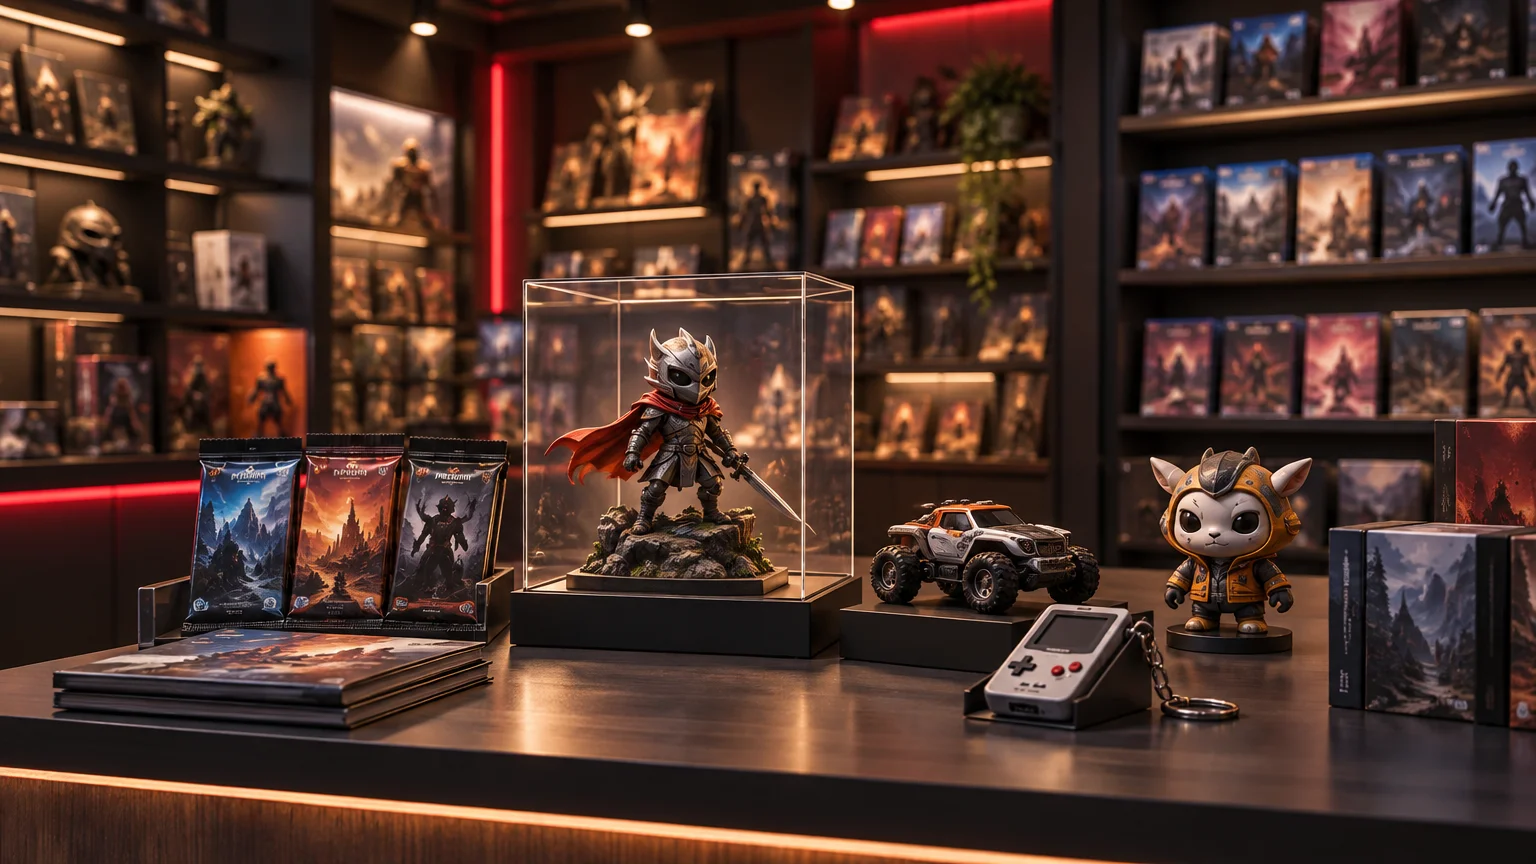
The headline needs an important qualification. GameStop defines Collectibles broadly. It includes new and pre-owned trading cards, but it also covers figures, apparel, plush products, board games, building sets, home goods and other collector-oriented merchandise. Fees from facilitating third-party card authentication and grading submissions are included as well.
GameStop does not report how much of the $356.3 million came from raw cards, graded cards, submission fees or any other subcategory. The disclosure therefore cannot support a claim that trading-card sales alone reached $356.3 million, accounted for 45.1% of company sales or produced the entire year-over-year increase.
There is still evidence that cards are an intentional part of the strategy. GameStop’s fiscal 2025 annual report discussed nationwide graded-card submission services, additional store space for collectibles, first-party repacks and Power Packs offered through Collectors Holdings’ PSA division. The same report said collectibles had increased from 19% to 29% of annual sales. Cards and card-related services are consequently more than a coincidental inclusion in the category, even though their individual financial contribution remains undisclosed.
Independent trade coverage also noted the reported 57% quarterly collectibles increase. ICv2’s coverage of GameStop’s collectibles growth characterized that rate as lower than the 65% growth it reported for the preceding quarter. That comparison suggests rapid growth has appeared across more than one recent quarter, but it still does not reveal which collectibles products supplied it or establish a long-term trend.
The results also show how much the traditional categories declined
Collectibles did not become the largest category merely by holding steady while the rest of GameStop grew. Video Games sales fell from $494.6 million to $263.2 million, while Pre-Owned & Refurbished declined from $250.0 million to $170.7 million. Collectibles grew strongly against that background, but its 45.1% share also reflects a smaller total-sales denominator.
Even the category names can invite misleading conclusions. GameStop’s Video Games category is not limited to boxed software. It includes new game hardware, accessories, physical and digital software, digital currency, PC gaming products and warranties sold on new products. Its decline therefore cannot be translated directly into a percentage decline for physical games, consoles or any other component.
GameStop attributed the overall sales decline primarily to comparison with the prior-year Nintendo Switch 2 launch, planned store closures and the divestiture of its France operations. Those explanations apply to the companywide result. The disclosure does not quantify how each factor affected the separate product categories, so it would be speculative to use them as a complete explanation for either the Video Games decline or the Collectibles increase.
Why collectibles fit GameStop’s physical retail model
The sales mix points toward a broader role for stores than simply stocking new game releases. Cards, figures and other collector products can give shoppers reasons to visit between major software launches. Grading-submission facilitation can also make a store part of a service transaction rather than only the place where a finished product is purchased.
That is an interpretation of the retail model, not a claim that the earnings release proved changes in customer traffic, repeat visits or loyalty. GameStop did not disclose those measurements. What the company did document is a larger collectibles category, card-related initiatives and a sharp increase in the category’s share of sales.
For physical game retail more generally, the result illustrates one possible adaptation: Use a gaming-focused store network to serve adjacent collector demand rather than relying exclusively on new hardware and software cycles. The model may be particularly relevant where products benefit from browsing, trade-ins, authentication or in-person community interest. Whether it is durable for GameStop will depend on demand, inventory management, margins and the repeatability of card-related services—none of which can be settled by this quarter’s category sales alone.
Higher company profit does not reveal collectibles margins
GameStop reported gross profit of $345.0 million and operating income of $160.2 million, up from $283.1 million and $66.4 million, respectively, in the prior-year quarter. Rising profit alongside falling sales is notable, but it is not proof that collectibles caused the improvement.
The company does not provide gross margin or operating profit by product category. As a result, the filing cannot answer whether a dollar of card sales is more profitable than a dollar of hardware, used merchandise or another collectible. It also cannot show how much grading-submission fees contributed to companywide profit. Investors and players should resist connecting the two headline trends without category-level margin data.
What this means for GameStop, TCGs and game retail
For GameStop, collectibles have moved from a complementary category to a central part of the disclosed sales mix. Management’s previously described investments in card services and store space make the direction look deliberate. The immediate strategic question is no longer whether collectibles matter, but whether their growth can offset weakness and volatility elsewhere without creating new inventory risk.
For trading card games, the figures demonstrate that a large gaming retailer sees enough opportunity to devote services and retail capacity to the category. They do not measure the wider TCG market, identify which games or card types are growing, or reveal how much of GameStop’s increase came from cards. Broader claims about the health of the TCG industry require market-level evidence beyond one retailer’s combined category.
For physical game retail, this is not evidence that GameStop has abandoned games. Video Games still produced $263.2 million during the quarter, and Pre-Owned & Refurbished added $170.7 million. Rather, the traditional identity of the store is becoming less complete as a description of what drives its sales.
The next results will matter more than the headline
The Q2 2026 report establishes three things: Collectibles grew quickly, became GameStop’s largest disclosed sales category and now account for nearly half of quarterly net sales. It does not establish that all of that business is trading cards, that collectibles drove the profit increase or that the mix is permanent.
The most useful next step is to watch subsequent quarters for repeatable collectibles growth, further category definitions and any disclosure of subcategory sales or margins. Until then, the defensible verdict is narrower than the boldest headline: Trading cards are clearly part of GameStop’s increasingly important collector strategy, while the company’s reported collectibles business is much larger and more varied than cards alone.